|
Comparing distribution and
abundance of perennial plants on dunes in a Great Basin Desert
habitat in Harney County, Oregon.
Sara Agner, Olivia Munzer, and Ellen Ward
Summer Session 1999 Field Course, BIOL
417a
Department of Biology
Western Washington University
Bellingham, WA 98225
Introduction
The Pueblo Valley in the south end of the Alvord Basin,
just east of the Steens Mt uplift, consists of a single layer shrub community with grass understory. Five types of landforms occur there: flats, hardpan, small dune, medium dune, and large dune. Flats contain firm sand and loose pebble. Hardpans consist of very compacted sand. Small dunes
appear to have looser sand, and are less than one-half meter above
the hardpan. Medium dunes have loose sand and rise about a meter
above the surrounding hardpan. Large dunes have steep slopes and loose sand,
and rise over two meters above the surrounding hardpan. Our goal was to survey
the perennial plants on each of these dunes and on the flats and determine if there were differences in flora type and number for each.
Back To Top
Methods
Line Intercept
The Line Intercept Method was the primary technique utilized in determining
data on perennial plant distribution and abundance. A 50-meter tape was stretched along the Large Dune #1 and Medium Dune #1 plots at 4, 10, and 16 meters. 45 meters of tape were stretched out along Small Dune #1 at 4, 8, and 12 meters. All plants that intersected the tape were surveyed for type, length along the line, width of plant, and height. The height of the plant was divided into direction; west, east or none-i.e., on the line. From these measurements, the following data can be obtained: percent cover, relative cover, frequency, and density.
- Percent cover = cover of X / line L * 100
- Relative cover = cover of X / cover of all * 100
- Frequency = species / unit
- Density = # individuals / unit
Belt Transect
The Belt Transect Method provided additional proof for the aforementioned principal method. For Medium and Large Dunes #1, 10 x 10 subplots were broken up into four 5 x 5 quadrats and numbered clockwise starting from the SE corner. One quadrat per subplot was randomly chosen and surveyed. Species type and abundance were recorded. Small Dune #1 was broken up into 5 x 5 meter quadrats and numbered from the SE corner to the NW corner. Three quadrats were chosen randomly from each of the columns from East to West. From these measurements, the density was obtained.
- Density = # individuals / area
Back To Top
Results
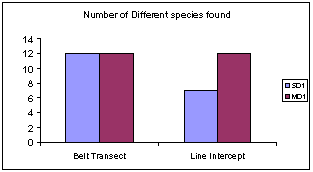
- The line intercept method gives an accurate description of the medium dune vegetation but underestimates the vegetation on the small dune (Figure 1).
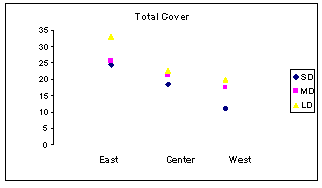
- Total cover was highest on the eastern slopes and lowest on the western slopes (Figure 2).
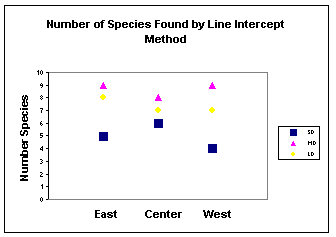
- Figure 3 shows that there is no relationship between the number of species present and location on the dune.
- Species type, number found, and transect location are shown for each of the small, medium, and large dunes in figures 4, 5, and 6.
- The total number of individuals per species per transect location is given in figure 7. Spiny hopsage shows a trend from larger to smaller numbers, east to west (Figure 5, 6, 7). Tall Sagebrush is most abundant on the eastern slopes and least abundant along the center (Figure 4, 5, 7). Shadscale appears to be most abundant on western slopes and least abundant along the center (Figure 4, 5, 7).
Back To Top
Conclusions
- There are differences among dunes in the number of
plants and number of species. The medium dunes had the greatest number of
plants and species, whereas the small dunes had the least.
- There are differences among dunes in the
distribution of perennial plant species.
- Future surveys should census all perennials on the
dunes and discern the effects of dune size, dune aspect,
and dune slope effects.
Back To Top
Figure 1
Back To Top
Figure 2
Back To Top
Figure 3
Back To Top
Figure 1
Back To Top
Figure 1
Home Course Description Course Application Practical Information Class Projects Photo Gallery
|
|