|
Using a Plant Census to Assess the Efficacy of
Two Vegetation Sampling Methods
Brian Buma, Jennifer Foster, Tate Mason, and Gina Sanguinetti
Summer Session 2001 Field
Biology Course, BIOL 417a
Department of Biology
Western Washington University
Bellingham, WA 98225
Introduction
- The most propitious method for estimating or actually counting the individuals of a species varies with the particular habitat and the relative need for accuracy.
- Two common methods for estimating the patterns of abundance as well as percent cover in perennial plants are the line-intercept method and the belt-line transect quadrat method. The relative utility of these methods depends on the time available for the work, the abundance of species, and the distribution of sizes and types of the plants being studied (Krebs 1999).
- The Alvord basin, located in Harney County in Southeastern Oregon; (East of Steens Mountain and Alvord Peak) is at the combined longitudinal and latitudinal limits of the Great Basin desert scrub community and tends to be dominated by the Basin Big Sage (Artemesia tridentata) found in sandy, less alkaline soils.
- With about a dozen species of perennials varying in abundance, size, and vegetation cover (between 25-50%), the Alvord Basin is a useful site for comparing some standard methods of estimating abundance, perennial plant sizes, types, and distribution.
- The objective of our study was to assess whether the increase in time required for the quadrat method was worth the increase in accuracy in the desert environment over the line transect method using the general census as a control. This comparison allowed us to determine the most accurate method for sampling based on a characterization of the vegetation composition the varying substrates.
Back To Top
Methods
- All the perennial plants, shrubs, and bunched grasses on a square, one hectare (100 x 100 meters) desert scrub plot in the Great Basin of Southeastern Oregon were censused and measured
(over 20,000 plants!). The plot included each of the three prevalent substrate types in the Alvord Basin (above the salt flats and playas): sand, dune, and hardpan.
- Thirty 10 meter long line-intercepts transects, ten 5 x 5 m quadrats in field, and ten 5 x 5 m quadrat samples on paper from census data were used as estimates of perennial plant species diversity.
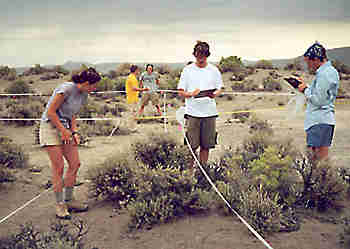
- Line Transect method: For each 10-m of line transect, the species of the plant intercepted by the line, then number of cm of each plant that was bisected by the line, and the amount of time required to complete each 10 m line transect (including setup, takedown and walking time between transects) were recorded.
- Quadrat Method Part A: Within each 5 x 5 m quadrat we identified and measured all the woody perennials and bunched grasses (species, maximum length, maximum width perpendicular to the maximum length, height) and time required to complete the quadrat (including setup, takedown, and walking time).
- Quadrat Method Part B: Quadrats were randomly selected in the same way as was done onsite, but data were from the preexisting census maps.
Back To Top
Results
- Census results identified twelve species of woody perennials or bunched grasses.
- According to the census, the top three species per 10x10m subplot are reported:
| A.
tridentata: |
53 in sand; |
35 in dunes; |
6 in hardpan |
| S.
vermiculatus: |
7 in sand; |
8 in dunes; |
7 in hardpan |
| A.
confertifolia: |
14 in sand; |
14 in dunes; |
6 in hardpan |
| Percent Cover in the Sand; three modes of estimation: |
|
Census |
Quadrat Method |
Line-Intercept Method |
| A. tridentata |
17.78 |
20.08 |
14.4 |
| S. vermiculatus |
3.86 |
2.36 |
4.38 |
| A. confertifolia |
1.06 |
1.03 |
1.03 |
| All Plants |
26.63 |
25.77 |
24.38 |
- As the percentage of sandy substrate within a 10 x 10m subplot increases, the number of
A. tridentata also increases.
- As the percentage of hardpan within a 10 x 10m subplot increases, the number of
A. tridentata decreases.
Back To Top
Conclusions
- Desert scrub and sagebrush flatlands are useful
study systems to ecology due to their relatively
simple nature; the study of simple systems is more
likely to produce definitive answers.
- With census data available, the comparison between the belt-line transect (quadrat method) and line-intercept method can be assessed as to which provided the greater accuracy and efficiency.
- Because we analyzed each of the plot's three distinct substrate types, the unique patterns of distribution and abundance were accurately characterized.
- The total time required to adequately characterize sand using the quadrat method was 1/26 of the time required for the census. Thus, the quadrat method is a highly time effective and accurate choice.
- The line-intercept method provides data that allow the calculation of the average distances between plants. Species distribution could then be analyzed for clumped distribution vs. random or regular very easily.
- Having completed both the line-intercept and the belt line transect (quadrat method), we found the quadrat method to yield higher accuracy than the line-intercept method. In order to characterize vegetation in the Great Basin, the time and effort that the line-intercept method spares is not worth its reduction in accuracy.
Back To Top
ARTR's on Hard Pan
Back To Top
Percent Cover in Sand by Line Transect
Back To Top
Precent Cover in Sand From Census
Back To Top
Average Number of Plants per Hectare (100 X 100m.) by Census
Back To Top
Percent Cover in Sand by Quadrats
Home Course Description Course Application Practical Information Class Projects Photo Gallery
|
|