|
|
 Sampling
Arthropods on Desert Plants Sampling
Arthropods on Desert Plants
Summer Session Field Biology
Course, Biol 417a, July 2000
Mary Wilson, Alison Wunschel, Jon McVeigh
Department of Biology
Western Washington University
Bellingham, WA 98225
Introduction
Deserts typically have a lot of bare ground with sparse vegetation. Arthropod prey in deserts must be concentrated near vegetation (the primary producers). In the Alvord
Basin of the Great Basin Desert, in southeastern Oregon, only a few species of
perennial plants are common. Hence, this habitat presents an opportunity to compare arthropod abundance and diversity among and within the plant species. Arthropods are intermediate in the food chain between the primary producers and the lizards. Our research in arthropod diversity was linked to the lizard ecology, which was also studied. The
study site is three miles south of Borax Lake in the north end of
the Pueblo Valley of the Alvord Basin. The Alvord Basin is the
the most arid part of Oregon; it is in the rainshadow of the Steens
Mountain uplift.
Back To Top
Methods
- We sampled arthropods on the three most common
perennial plant species in that part of the Alvord
Basin: Greasewood (Sarcobatus verniculatus), Sagebrush (Artemesia tridentata), and Spiny Hopsage (Grayia spinosa).
- Eighteen plants of each species were measured
for length, width, and height to enable a volume estimate.
One week prior to bagging and sampling the bugs on
the plants, we removed the protruding portions of
stems as a means to prepare the plants for rapid,
proficient bagging.
- Three different size categories for each species were sampled to represent the species size range. Three samples per size were taken at early, mid, and late day for six days.
- One fourth of the above ground vegetation of
each plant was placed in a translucent plastic bag, stems were cut,
the samples were fogged with insecticide, and the
closed-bag contents were incubated for a half-hour.
- Plants were shaken vigorously than removed from the bag. The debris was sifted through for arthropods and galls, and the plants were examined further for arthropods and galls.
- Arthropods and galls were preserved in 95% ethanol and taken back to Western Washington University for further study.
- Wet weight was taken of the plant samples in the Alvord Desert. At Western, plant samples were dried and above ground biomass was measured.
- Arthropods were keyed out to taxonomic orders.
Back To Top
Results
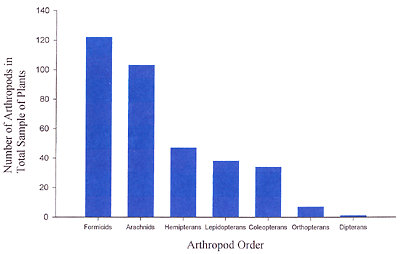
- Formicids were the most common arthropods found in the sampling (Fig. 1).
- Other orders found were Arachnids, Hemipterans, Lepidopterans, Coleopterans, Orthopterans, and Dipterans (Fig. 1).
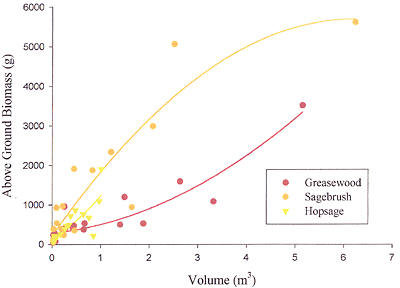
- The biomass of Greasewood and Hopsage increased exponentially with volume (Fig. 2).
- The biomass of Sage also increased with volume but then leveled off (Fig. 2).
- Greasewood had the highest abundance of arthropods and Hopsage the lowest (Table 1).
- The biomass of Sage was twice that of Greasewood and almost four times that of Hopsage (Table 1).
- Hopsage had the highest Shannon-Wiener diversity index for orders (Table 2).
- Sage and Greasewood had similar results for the S-W diversity index (Table 2).
Back To Top
Conclusions
- Greasewood offered the most protection and vegetation for the insects, which explains the large diversity and abundance of insects found on the plant.
- Sage also showed diversity and abundance of insects but not as much as the Greasewood. Sage was a woodier plant with less vegetation to provide protection and nutrition for insects. More galls were found on the Sage due to its woody composition.
- Hopsage did not provide protection or much nutrition for insects. The vegetation was sparse and stems were fairly thin.
- Size of plants did play a part in the abundance and diversity of insects. With a larger volume the vegetation provided the insects with protection and nutrition.
- The whole plant sampling method was effective in representing the diversity of arthropods in the Alvord Desert.
Back To Top
Figure 1 - Number of Arthropods Found on Total Sample of Plants in Alvord Desert
Back To Top
Figure 2 - Volume to Biomass Regression for Vegetation in Alvord Desert
Back To Top
Table 1 - Total Number of Arthropods Related to Shrub Type & Size
| Shrub Characteristics |
Small |
Medium |
Large |
Combined |
 |
| # Sampled |
6 |
6 |
6 |
18 |
|
| Greasewood Arthropod # |
49 |
87 |
86 |
222 |
| Greasewood Dry Mass (g) |
780 |
3156 |
8423 |
12360 |
|
| Sage Arthropod # |
12 |
23 |
68 |
103 |
| Sage Mass (g) |
1667 |
4403 |
18825 |
24896 |
|
| Hopsage Arthropod # |
7 |
23 |
8 |
38 |
| Hopsage Mass (g) |
789 |
2609 |
5529 |
8926 |
Back To Top
Figure 2 - Measures of Arthropod Diversity in Plant Samples
|
Number of Plants Sampled |
Number of Taxonomic Orders (per all 18
plants) |
Range of # of Arthropods per Order |
Total Number of Arthropods (per all 18
plants) |
S-W Diversity Index, for Orders |
Average Number of Arthropods per Plant Sample |
|
| Grease |
18 |
6 |
1 - 33 |
222 |
0.64 |
12 |
|
| Sage |
18 |
6 |
1 - 11 |
103 |
0.62 |
6 |
|
| Hop |
18 |
7 |
1 - 2 |
38 |
0.69 |
2 |
Home Course Description Course Application Practical Information Class Projects Photo Gallery
|
|
|
|