 |
 |
Using Pit-Traps to Analyze Arthropod Distribution and Abundance
Erin E. Ashe, Dan J. Spencer, Jill N. Keepers
Summer Session 2000 Field Biology Course, BIOL 417a
Biology Department,
Western Washington University
Bellingham, WA 98225
Introduction
The study site for the investigation of desert lizard ecology in the Alvord Basin in Southeast Oregon comprised of five habitat types: silty hardpan depressions, sandy with small shrubs, sandy with larger shrubs, sandy with mixed shrub and grass, and dune with mixed small and large shrubs.
Quantifying the arthropod distribution would provide a more complete understanding of lizard foraging ecology, as arthropods represent the middle trophic level between the primary producers and lizards. Moreover, the dune habitat is a simple, well-defined subhabitat with only three common species of perennials; Greasewood (Sarcobatus vermiculatus), Basin Big Sagebrush (Artemesia tridentata), and Spiny Hopsage (Grayia spinosa). Hence, this scenario provides an alluring opportunity to examine the influence of plant type and size on the associated arthropod abundance and diversity.
Pitfall traps, consisting of tin cans and plastic cups filled with propylene glycol, provided an efficient means of capturing primarily terrestrial arthropods and some flying insects.
Back To Top
Pit-trapping
- Pit-trap traplines were selected based on micorhabitat differences and vegetation subcommunities within lizard study plots of two sizes: 150 x 150 m (south plot) and 130 x 80 m (north plot).
- The five microhabitats selected in both the south and north plots included (1) hardpan, (2) dune, (3) small perennial-dominant, (4) large perennial-dominant, and (5) rabbit grass and bunch-grass. A medium-sized dune was selected in the south plot for sampling.
- The medium dune in the south plot was comprised of three dominant species of perennials; Greasewood (Sarcobatus vermiculatus), Basin Big Sagebrush (Artemesia tridentata), and Spiny Hopsage (Grayia spinosa).
- Traplines were set with traps approximately 5 m apart in the various microhabitats in north/south or east/west orientations within the two lizard study plots. Along the medium dune the traps were placed under plants of various sizes. Greasewood sizes were small (0.75 m), medium (1.5 m) and large (2.25 m); Sagebrush sizes were small (0.5m), medium (1.0 m) and large (1.5 m). Hopsage had only two sizes of small (0.5 m) and large (1.0 m).
- We buried Campbell soup cans (diameter of 6.5 cm) into the ground until the lip of the can was flush with the ground, surrounding substratum surface was restored so as to appear undisturbed. Plastic cups were inserted so that the tops of the cups were flush with the tops of the cans. The cups were filled 1/3 full with propylene glycol to trap and kill arthropods. Propylene glycol resisted evaporation and functioned as a preservative for the arthropods.
- Pit traps were in place for one week (seven days, seven nights), then samples were poured into 40 dram snap cap vials, labeled and returned to WWU for analysis.
- Arthropods collected in the vials were counted and keyed according to order.
Back To Top
Substratum
- · Substrata was characterized using line transects established by the Plant Ecology group. Data for all substrata 5 cm and under was qualitatively evaluated by designating substrata types as percent cover.
- · The 18 transects (20 m each) used to estimate substratum distribution and abundance, were evenly spaced over the study site (randomly placed within each 25 m by 50 m rectangle) to accurately represent the variation among the substrata.
Back To Top
Results
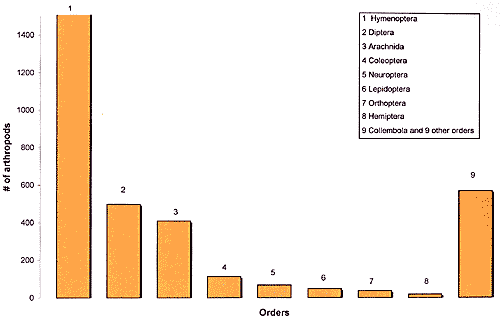
- Arthropods in the order Hymenoptera were more numerous in pit-traps (1577 arthropods) than all other orders. Most of the Hymenoptera were wingless ants. Surprisingly, the next highest order was winged insects in the Diptera, with 498 arthropods. See Figure 1
- Comparisons of Shannon-Weiner diversity amongst habitats revealed little difference. Hardpan had the lowest index of 0.58 and the sandy flat with numerous small sage had the highest index of 0.68. See Table 2
- Hopsage had the highest number of arthropods per trap with 50.4 versus 42.8 for sage and 40.5 for greasewood. See Table 4
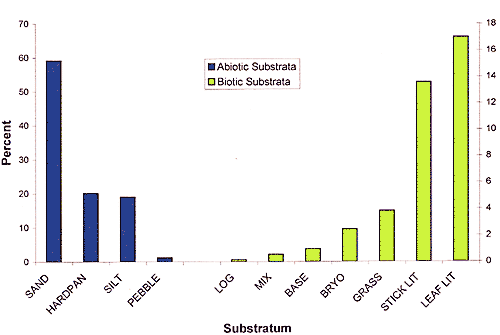
- The transect data revealed sand as the prevalent abiotic substratum, 59.2%. The next highest was hardpan with 20.1%. The lowest percentage of abiotic substratum was pebble with 1.2%. See Figure 2
- Of the biotic substrata leaf litter and stick litter had the highest percentages with 17% and 13.6% respectively. The lowest percentage was log with 0.1%. See Figure 2
Back To Top
Conclusions
- Pit-trapping was an effective yet inexpensive method to capture arthropods. They were surprisingly efficient for catching winged insects such as Diptera.
- Hymenoptera were the most abundant arthropod present in the desert, followed by Diptera.
- Sand and leaf litter were the most dominant forms of abiotic and biotic substrata.
- Pit-traps and substratum characterization contribute to a more profound understanding of desert lizard ecology by revealing the numbers of arthropods available for the lizards to eat and the substrata upon which lizards forage.
- Hopsage is a low hemispherical plant with most of its vegetation close to the ground compared to the sage and greaswood. We think this explains why there are more arthropods per trap for hopsage than for the other two.
- Given the low numbers of some of the major groups of arthropods in pit-traps, the number of pit-traps used per plant species should be doubled if we are to determine the influence of plant size on arthropod abundance.
Back To Top
Figure 1 - Total Arthropod Distribution from Pit-trapping

Back To Top
Figure 2 - Array and Abundance of Substrata(Animal Walking Surfaces)

Back To Top
Table 2 - Arthropod Distribution and Diversity by Habitat
 |
Total for 8 Orders |
Total for Collembola and others |
# Traps |
# Arth per Trap |
Diversity Index |
| Dune |
512 |
42 |
15 |
36.9 |
0.64 |
| Hardpan |
681 |
22 |
26 |
27.0 |
0.58 |
| Large Veg |
551 |
168 |
15 |
47.9 |
0.64 |
| Small Veg |
581 |
175 |
20 |
37.8 |
0.68 |
| Grass |
444 |
162 |
15 |
40.4 |
0.67 |
Back To Top
Figure 4 - Arthropod Analysis of Dune, Summary
| Plant Species |
# of Plants |
# Traps |
Total # Arthropods |
# Arthropod Orders |
# Arth per Trap |
| Sage |
12 |
24 |
1028 |
15 |
42.8 |
| Gwood |
12 |
24 |
971 |
11 |
40.5 |
| Hsage |
12 |
18 |
907 |
11 |
50.4 |
Home Course Description Course Application Practical Information Class Projects Photo Gallery
|
 |
 |
|

